Utilizing schedule reports
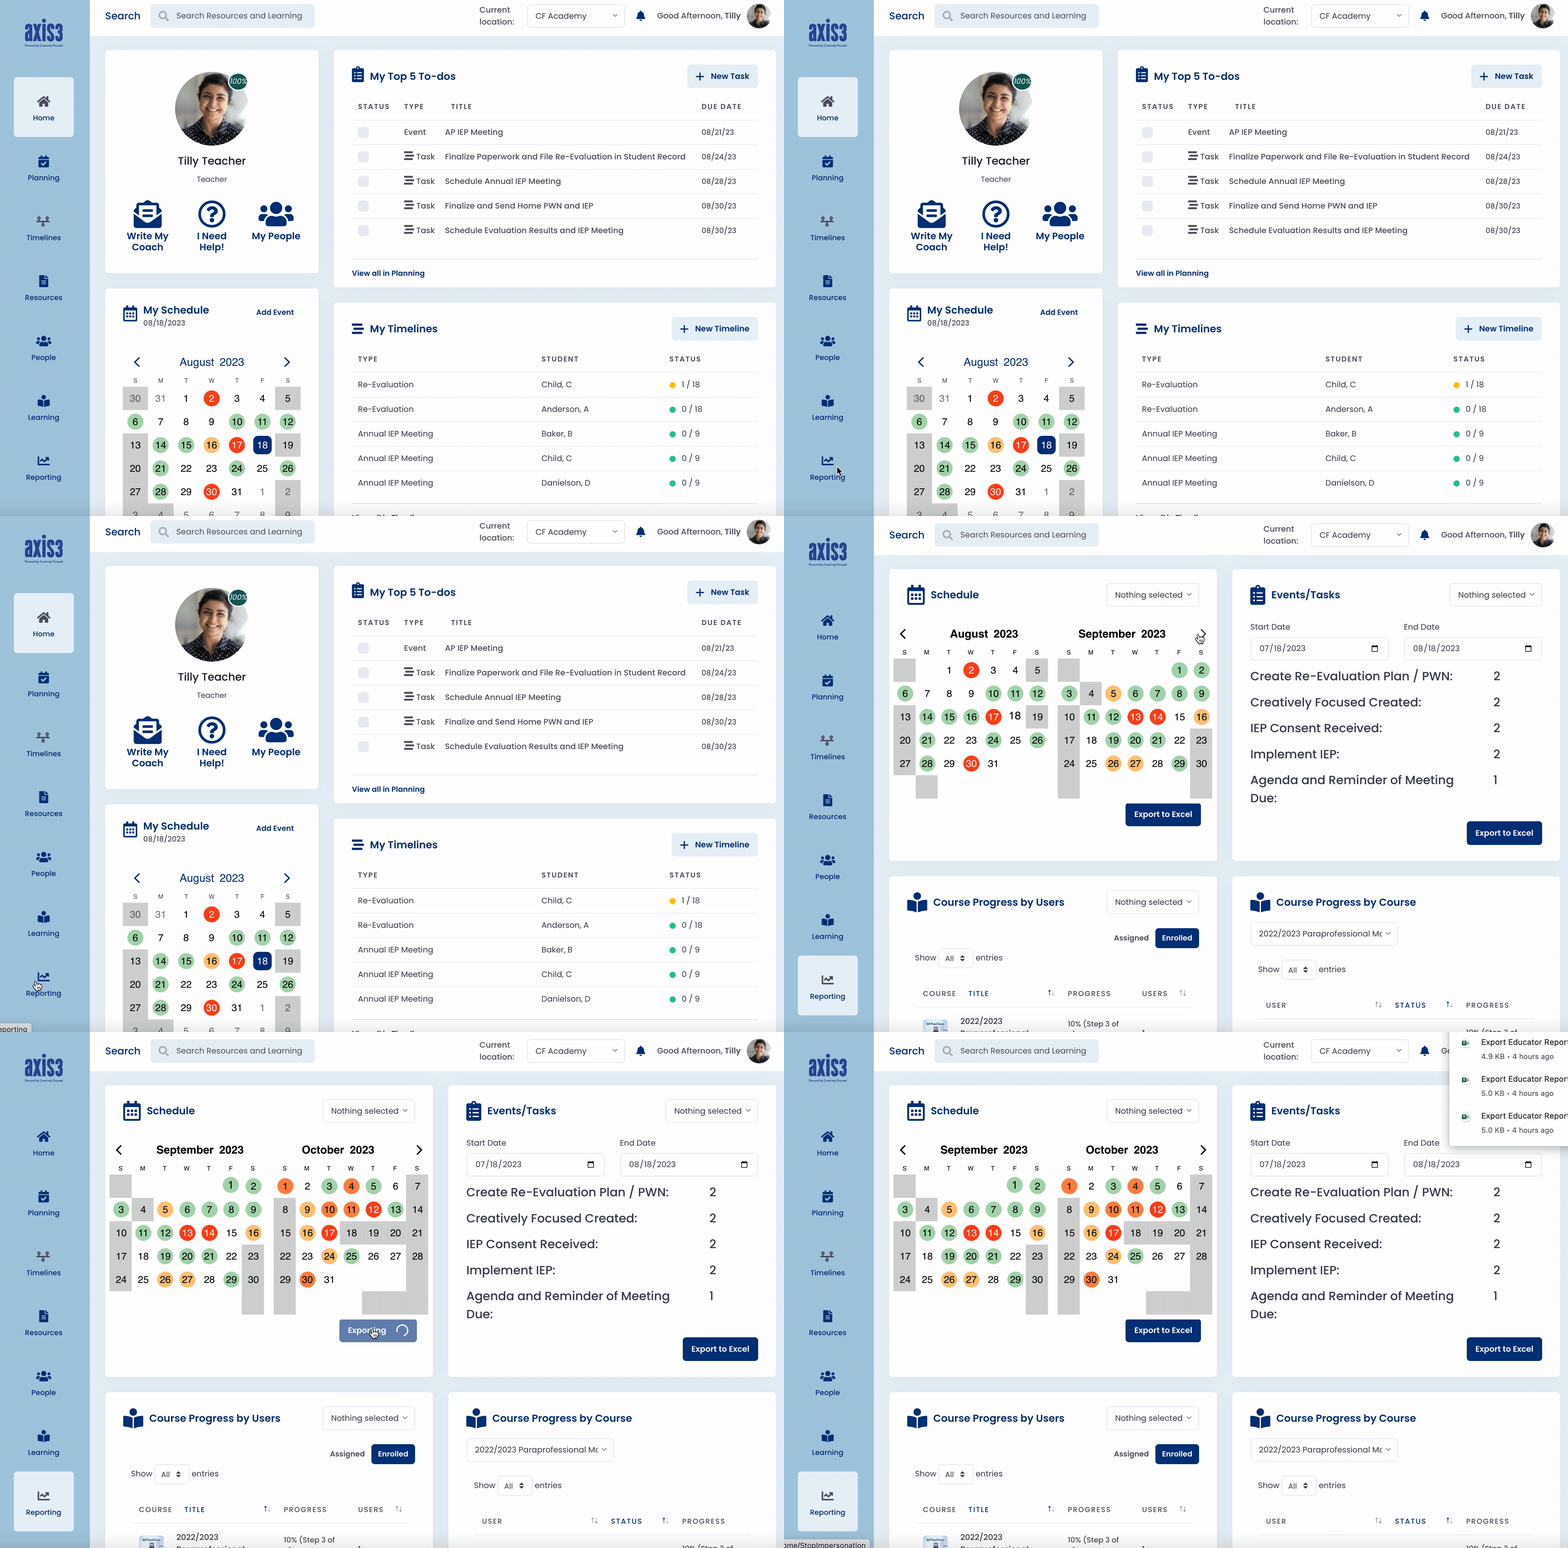
Schedule reports can be found on your Schedule page. The Schedule Summary Report Card allows you to see a heatmap of your schedule by month. Exported reports will provide you with a more detailed list of events on your schedule for the two-month period visible on your Summary Report Card that can then be sorted by event type or date.
NOTE: The colors on the heatmap of your schedule indicate the number of events or tasks scheduled for a given day.
- Green= 1 Event/Task
- Goldenrod = 2 Events/Tasks
- Orange = 3 Events/Tasks
- Red = 4 or More Events/Tasks
Step 1 (of 3): Navigate to your Reporting page by selecting "Reporting" from the left navigation menu.
Step 2 (of 3): Use the left and right arrows to change the months viewed in the Summary Report Card.
Step 3 (of 3): Select "Export to Excel" to download a more detailed report.

Gif showcasing running a schedule report
